EEG Working-Memory Biomarker
Reading working memory out of the brain signal itself.
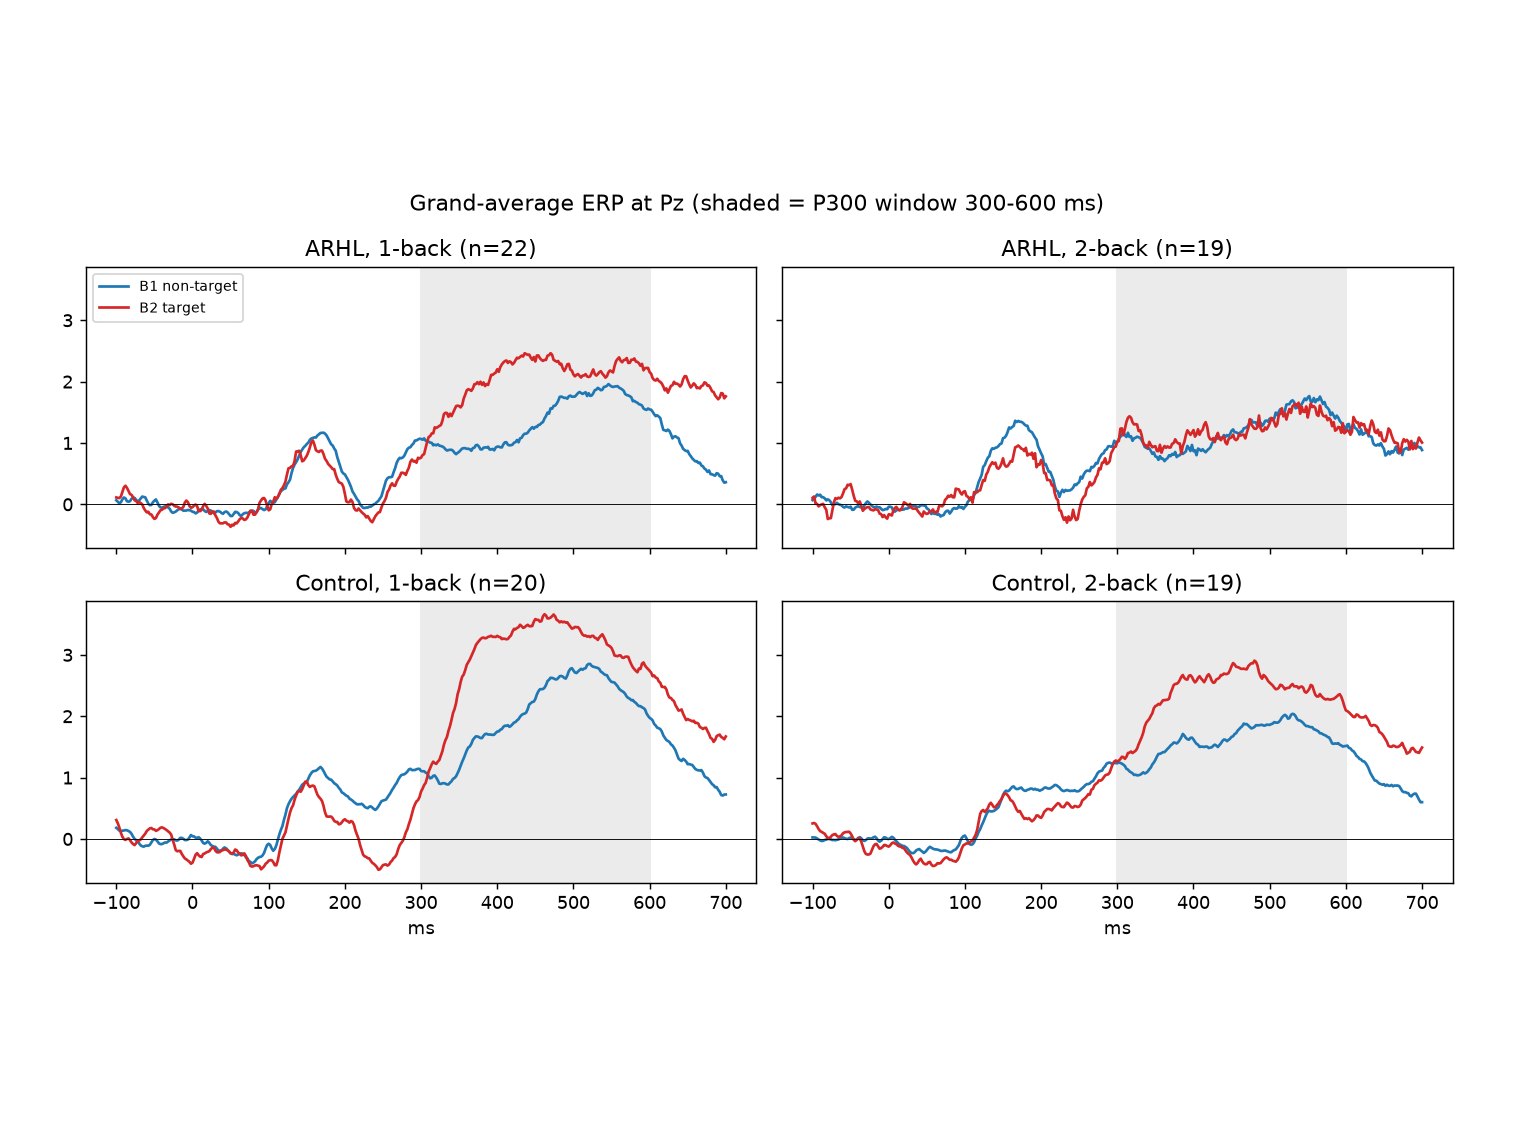
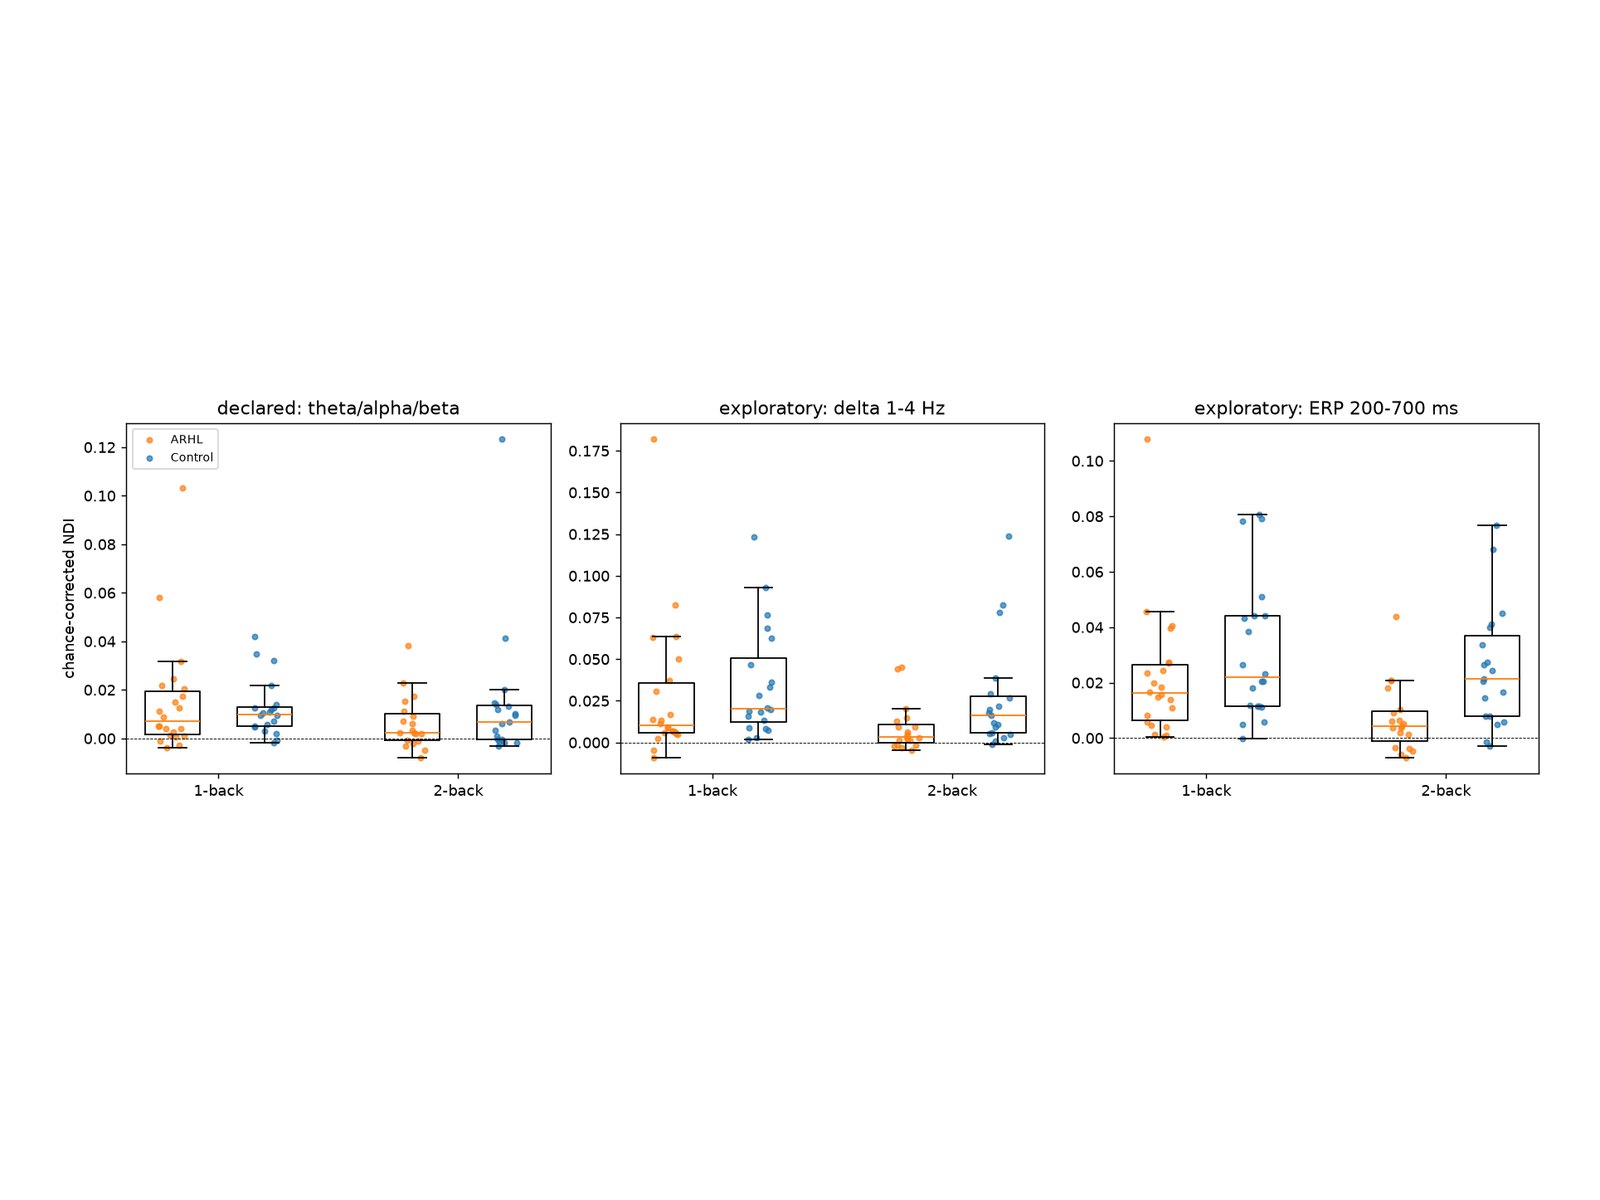
Theta, alpha and beta barely tell a memory match from a non-match. The difference sits below 4 Hz, in the slow P300 response, and the CNN found it there on its own.
Overview
A twelve-stage Python pipeline that tests whether working memory can be read from EEG. The data: 32-channel EEG at 500 Hz from 43 older adults, 23 with age-related hearing loss and 20 with normal hearing, recorded during 1-back and 2-back tasks in an unpublished PhD study at MAHE, Manipal. The data stay private; the code and group-level results are public.
Problem
Working memory is one of the first things to slip with age, and paper tests miss the early changes. The question: can a person's EEG alone show how distinctly their brain answers a memory match?
System
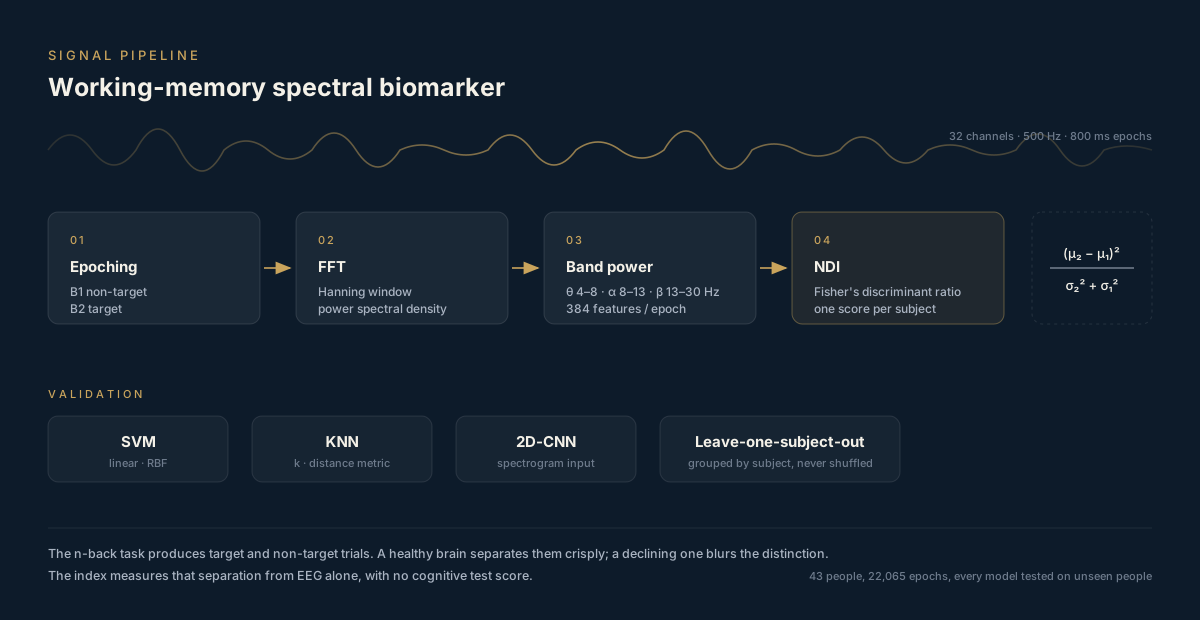
In an n-back task the brain should treat a target (a memory match) differently from a non-target. 384 FFT band features per epoch feed a Neural Discriminability Index: Fisher's ratio between one person's target and non-target epochs, at equal sample sizes and corrected for chance. The same features train SVM and KNN classifiers, and 32 × 74 spectrograms train a 2D-CNN, all tested on people the models never saw.
How it works
- Export: 22,141 epochs read from the Brainstorm protocol, channels put in one order by name, and checked for gaps, flat channels and counts. Quality control dropped 33 epochs and one recording.
- Features: a Hann-windowed FFT of each 800 ms epoch gives band energy, mean power, spread and variance in theta, alpha and beta on all 32 channels, 384 features, log-transformed. The same FFT gives a 32 × 74 spectrogram from 1 to 30 Hz.
- The index: Fisher's ratio between target and non-target epochs, on 33 epochs per class drawn 50 times, minus its average over 200 label shuffles.
- Channel ranking: mutual information, chi-square and recursive feature elimination, with scalp maps.
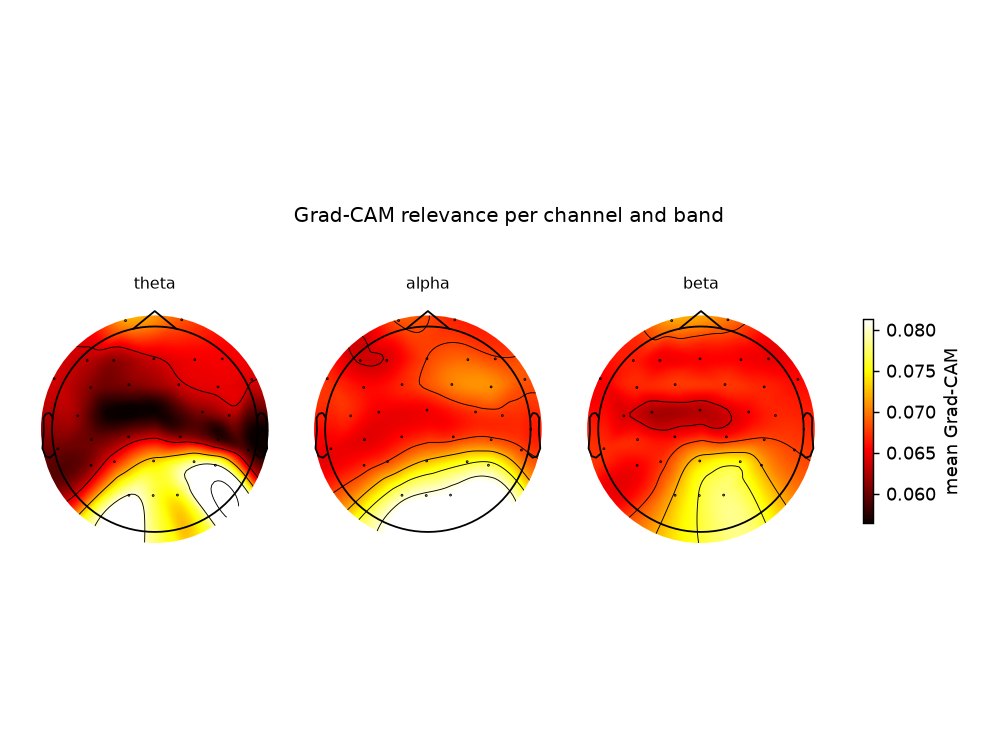
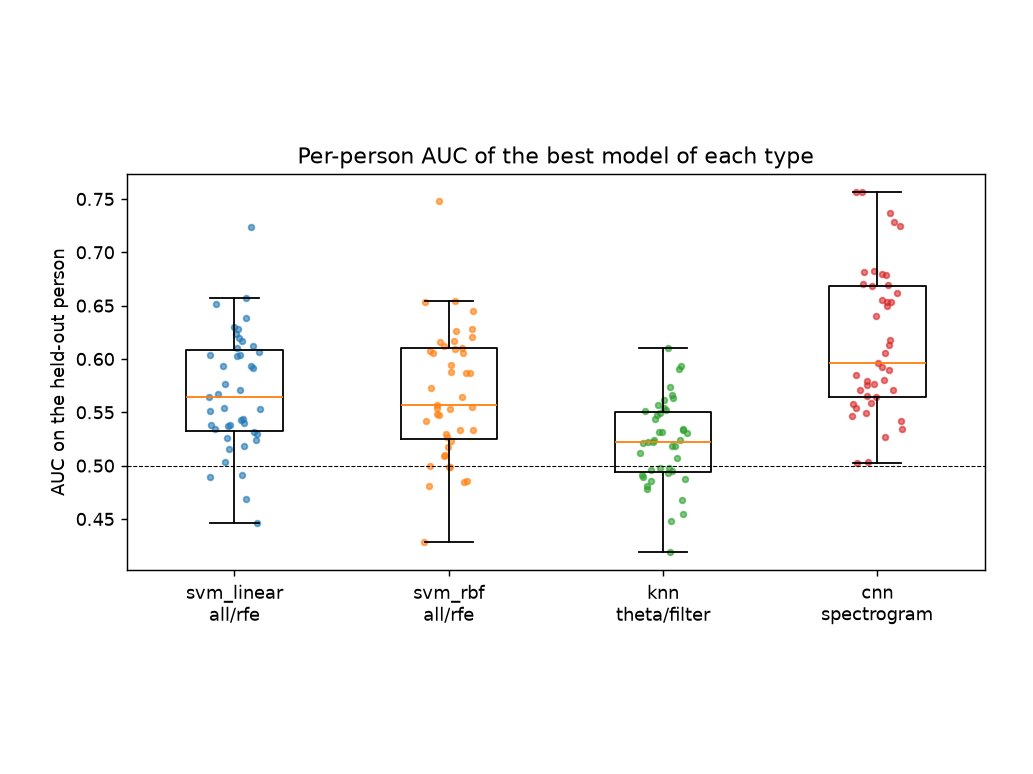
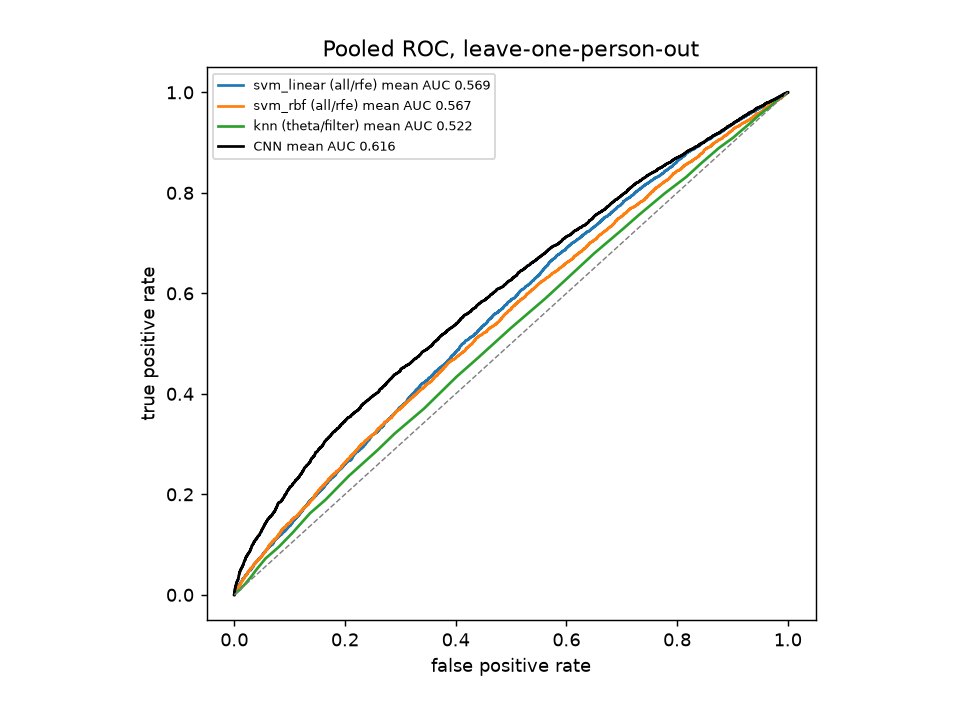
- Classifiers: linear and RBF SVM and KNN behind scaling and SMOTE, tuned by grid search, over 43 leave-one-person-out folds. Then a 2D-CNN in PyTorch, explained with Grad-CAM.
Software
- A small package (I/O, features, the index, selection, models, the CNN, statistics) and one script per stage, each rerunnable on its own.
- Every analysis choice is fixed in one config file before any result; anything added after seeing results is labelled exploratory.
- No leakage: scaling, SMOTE, feature selection, tuning and early stopping only ever see the training people, and a person's two recordings stay together.
- Permutation tests, Mann-Whitney and Wilcoxon tests, mixed models, bootstrap intervals and FDR correction.
- 12 unit tests, and the reports are built straight from the result files.
My part
Team of four under Prof. Shrishail Bhat. I own the signal-processing path, from raw epochs to the feature set.
Challenges
A biased index
Fisher's ratio is above zero even on pure noise, by about 1/n. Every recording is scored on the same 33 epochs per class and corrected against shuffled labels. SMOTE stays out of it: synthetic epochs shrink the variance and inflate the score.
A CNN that gave up
At the specified learning rate of 0.001, several folds collapsed to a constant output (loss ln 2, AUC 0.5). The training curves showed it; 0.0001 fixed it.
Short epochs
800 ms gives 1.25 Hz resolution, about three independent bins across theta. Zero-padding smooths the spectrum but adds no information, which limits what theta can show here.
Result
On 22,065 clean epochs from 43 older adults, the band-power index is above chance across recordings (p < 0.001) but small, and it doesn't separate hearing loss. In an exploratory follow-up, the same index on the evoked response is much lower in hearing loss at 2-back (p = 0.002, a large effect) and falls with memory load, matching the source study. For target against non-target in unseen people, the CNN reached AUC 0.616 against 0.569 for the best SVM (chance 0.5), and Grad-CAM shows it relies on 1-3 Hz power over the back of the head.
What's next
- Confirm the evoked-response index on new people and against individual memory scores.
- Re-cut the recordings into longer epochs to study theta and alpha properly, with per-trial reaction times.
- Use the study's 6-month follow-up to see whether the index tracks change over time.